Voronoi Diagrams
Let S be a set of points in the plane called sites.
For any point p in the plane let close(p) be
the set of sites that realize the closest distance between p
and the sites of S. For most points p, close(p)
consists of only a single site. For some, close(p) contains
two or more sites. The points p where close(p)
contains two or more sites form the Voronoi diagram of S.
There is also a furthest site Voronoi diagram. For any point p
of the plane let furthest(p) be the set of sites that realize
the furthest distance between p and the sites of S.
The points p where furthest(p) contains two
or more sites form the furthest site Voronoi diagram S.
|
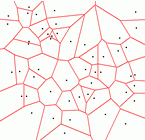
On the right you see a Voronoi diagram of a set of 50 points in the plane. The picture is a screenshot from the example of computing and verifying a Voronoi diagram. |
 |
Properties of Voronoi Diagrams
- A Voronoi diagram has a graph-like structure:
- The nodes are the points
pwith|close(p)|>=3. - The edges are the maximal connected sets of points
pwith|close(p)|=2. - The faces are the maximal connected sets of points
pwith|close(p)|=1..
- The nodes are the points
- Let
ebe an edge of the Voronoi diagram such thatsandtare the two sites ofSwithclose(p)={s,t}for all points ofe. Theneis a straight line segment contained in the perpendicular bisector ofsandt. - Consider a face
fof the Voronoi diagram and letsbe the site such thatclose(p)={s}for all points off.- The distance of all points of
fto s is smaller than to all other sites. fcontainss.fis an open convex polygonal region.
- The distance of all points of
Representation of Voronoi Diagrams
Voronoi diagrams are represented by parameterized
plane map of type GRAPH<CIRCLE,POINT>.
- There is a node in the graph for every node of the Voronoi diagram.
- We place a "node at infinity" on every unbounded edge of the Voronoi diagram.
- There is an edge in the graph for every edge of the Voronoi diagram.
- Every edge is labeled with the site whose region lies to the left. See also Orientation and Sidedness.
- Every proper node
vis labeled by aCIRCLE(a,b,c)wherea,b,care distinct sites whose regions are incident tov. The center of the circle is the position ofvin the plane. - Every node
vat infinity lies on the perpendicular bisector of two sitesaandb.vis labeled byCIRCLE(a,x,b)wherexis an arbitrary point collinear withaandbandvlies to the left of the oriented segment fromatob.
Remark: We use the notation CIRCLE (POINT) to indicate
that the algorithm works both for circles (points) and rat_circles
(rat_points). See also Writing
Kernel Independent Code.
Running Time
The running time of the algorithms for computing Voronoi diagrams is O(nlogn).Verification of Voronoi Diagrams
The functionbool Is_Voronoi_Diagram(const GRAPH<CIRCLE,POINT>& G, delaunay_voronoi_kind kind)checks whether
G is a Voronoi Diagram of the points associated
with its nodes. The flag kind allows to choose between the nearest
(kind=NEAREST) and furthest (kind=FURTHEST) site
version. See also Verification of Geometric
Structures.See also:
Writing Kernel Independent Code
Verification of Geometric Structures
Duality between Voronoi and Delaunay Diagrams
Applications:
Minimum Width and Minimum Area Annuli